ADU Property Value: A 65.4% National Gap in 2023, Plus Utah Data
By Utah ADU Builders Research · Updated September 2026
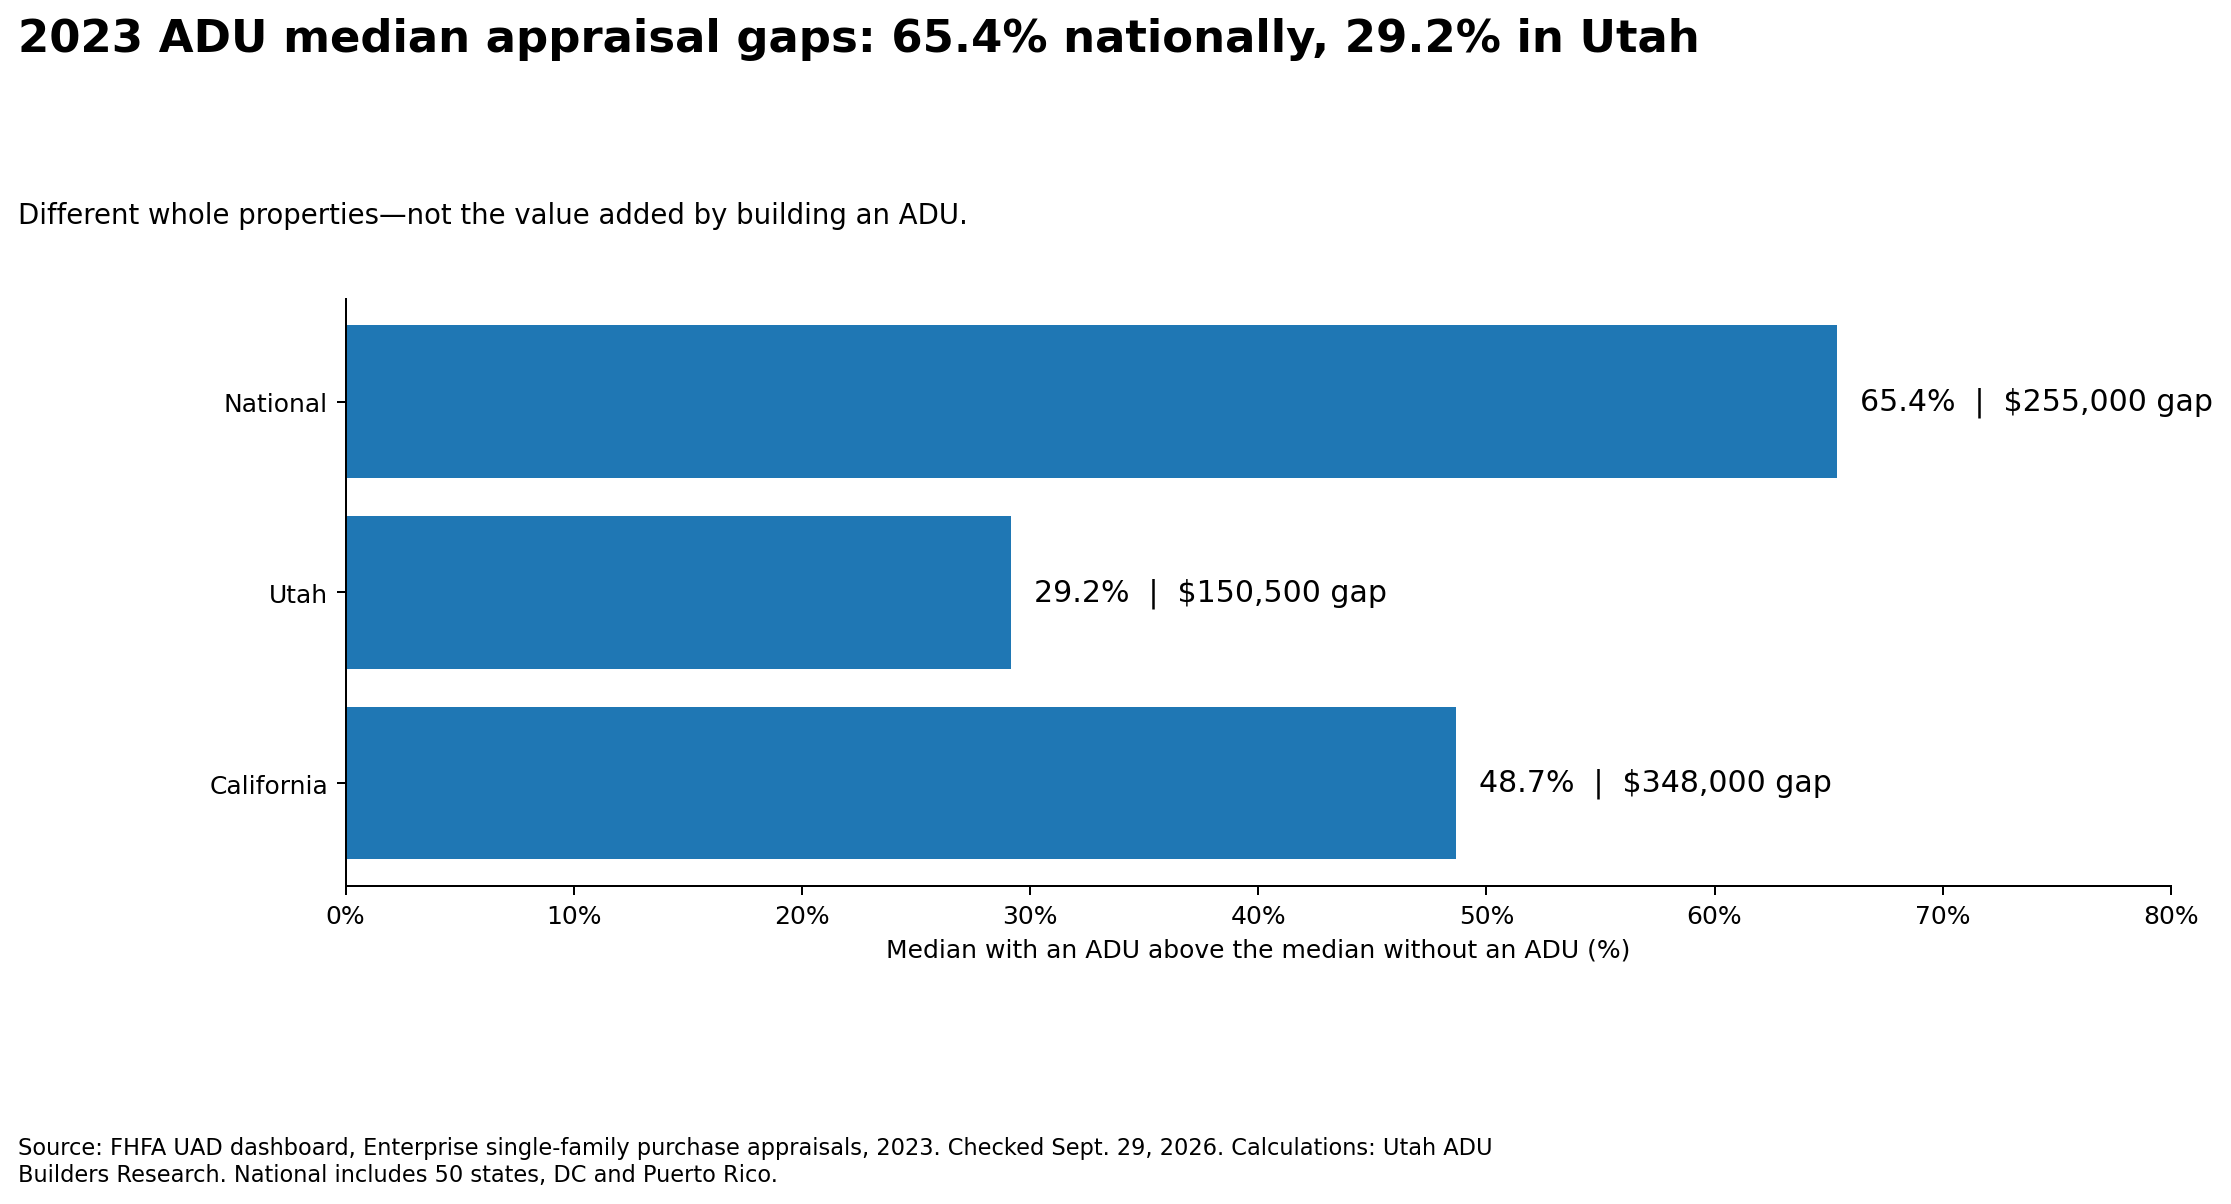
Homes with ADUs (accessory dwelling units) had a 65.4% higher national median appraisal in 2023: $645,000 versus $390,000. Utah's gap was 29.2%, according to Utah ADU Builders Research's September 2026 analysis of FHFA's purchase-appraisal tables. These ADU property value gaps compare whole properties—not the value added by building an ADU. See the table and full yearly data below.
| Geography | Median with ADU | Median without ADU | Dollar gap | Gap above without-ADU median | Appraisals with ADU | Appraisals without ADU |
|---|---|---|---|---|---|---|
| National | $645,000 | $390,000 | $255,000 | 65.4% | 25,888 | 2,053,409 |
| Utah | $666,500 | $516,000 | $150,500 | 29.2% | 636 | 24,493 |
| California | $1,063,000 | $715,000 | $348,000 | 48.7% | 4,909 | 161,730 |
Source: FHFA UAD dashboard, Enterprise Single-Family → Purchase → Accessory Dwelling Unit Present → Yes/No → Annual → 2023. Medians and counts read directly from table cells; gaps calculated by Utah ADU Builders Research. Checked Sept. 29, 2026. National coverage includes the 50 states, DC and Puerto Rico. These are records, not counts of ADUs built; no missing-category count was retrieved.
Key ADU property value figures
- 65.4%: National median purchase appraisals were $645,000 for homes with an ADU and $390,000 without one in 2023—a $255,000 gap. Utah ADU Builders Research calculation from FHFA dashboard medians; different properties, not an ADU construction payoff.
- 29.2%: Utah's 2023 median purchase appraisal was $666,500 with an ADU versus $516,000 without one—a $150,500 gap, based on 636 ADU-present and 24,493 ADU-absent appraisal records. Utah ADU Builders Research calculation from FHFA dashboard data; not the ADU's stand-alone value.
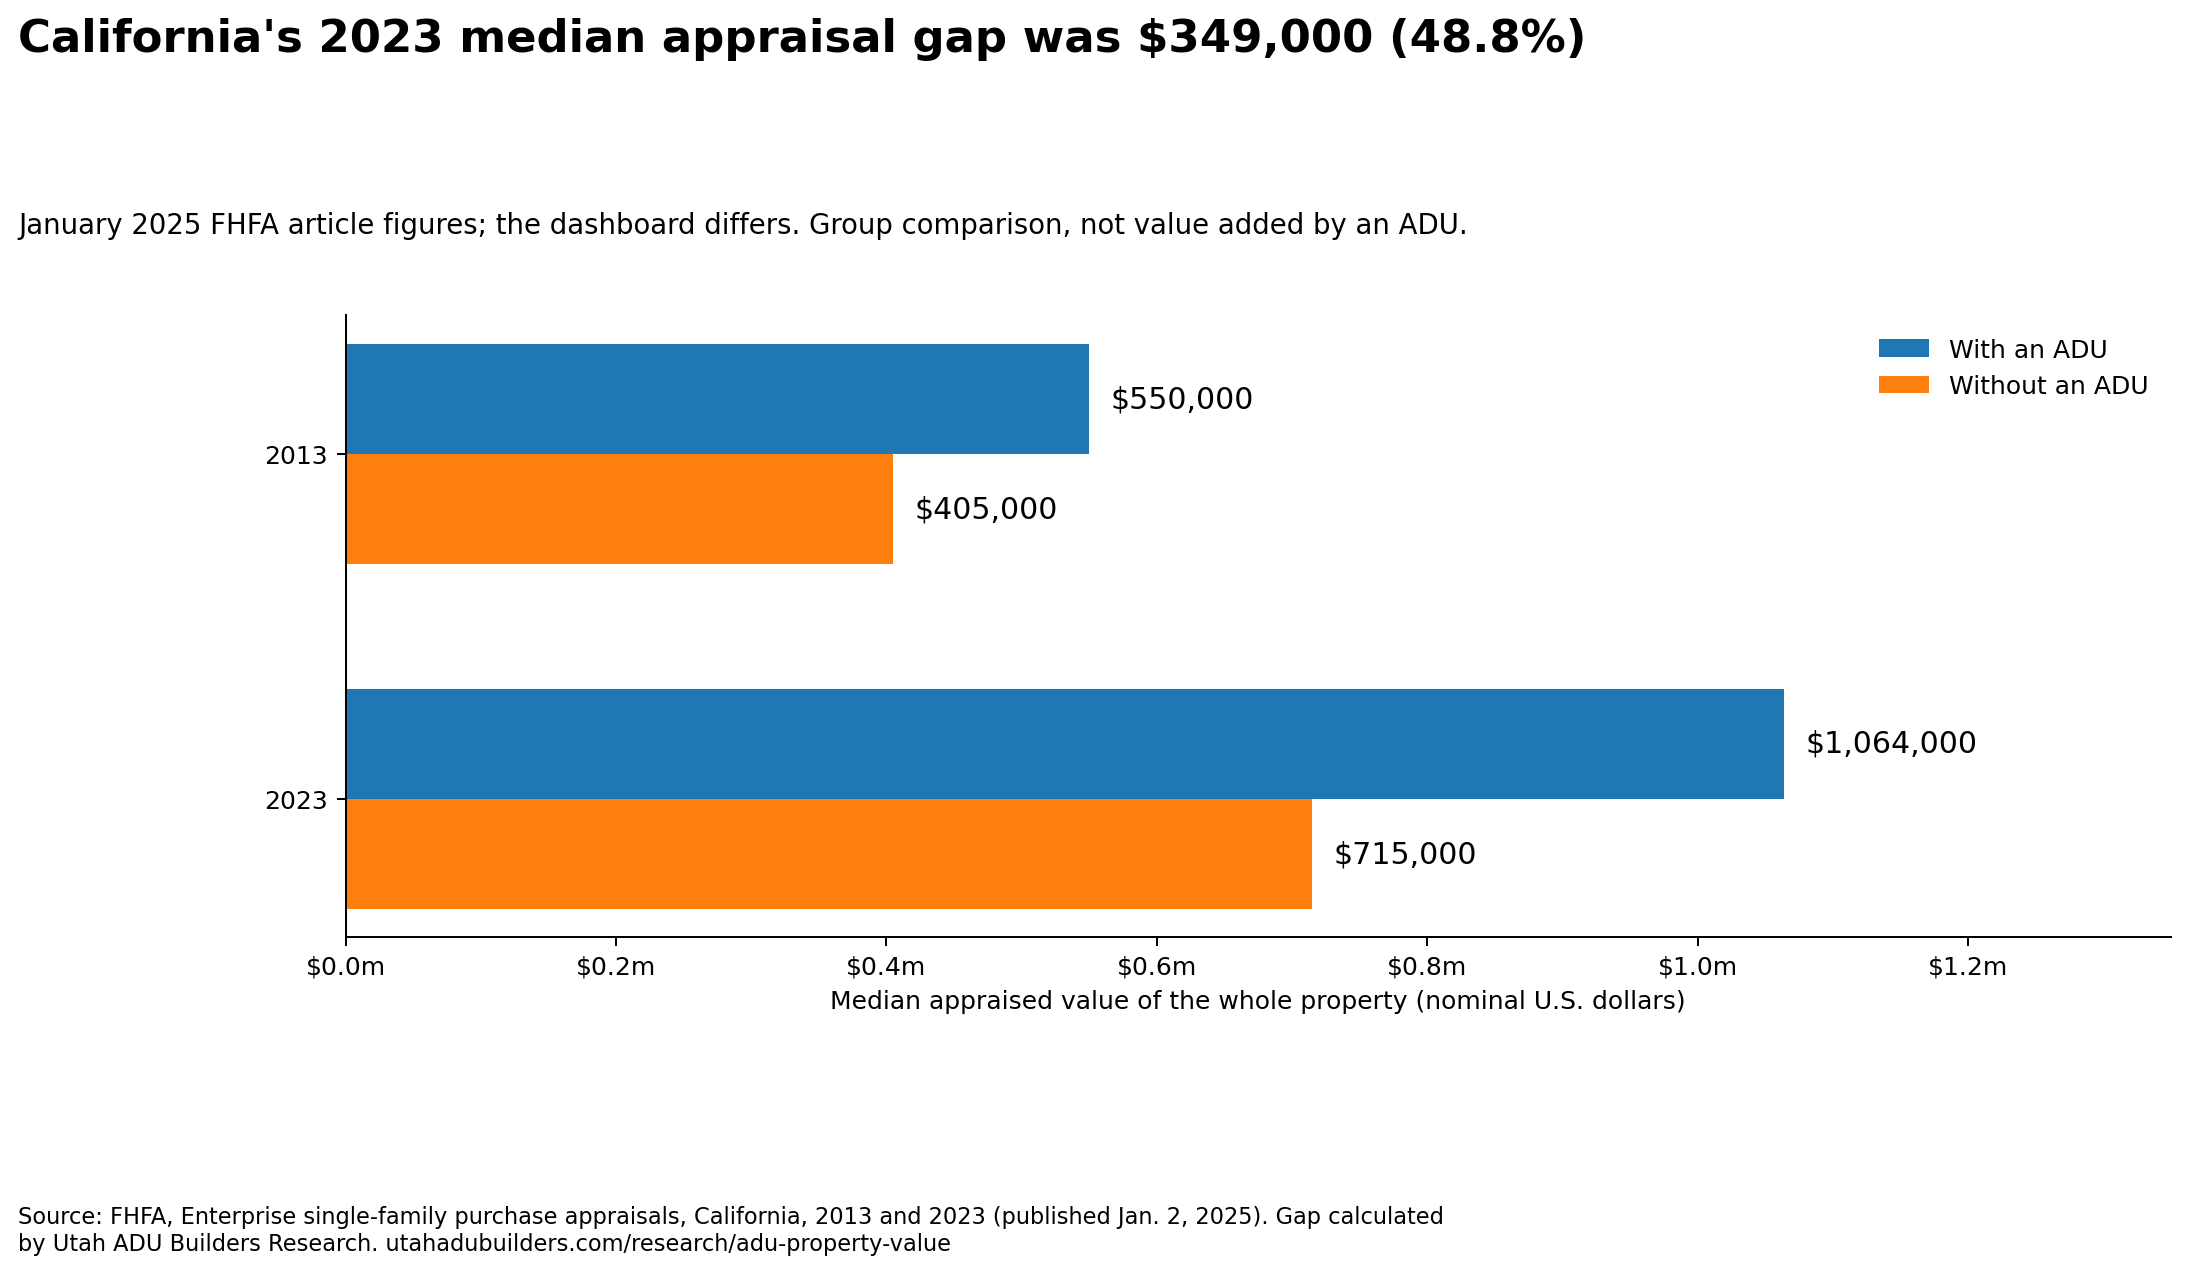
- 48.8%: In FHFA's January 2025 article figures for 2023, the median appraisal for California homes with an ADU ($1,064,000) was 48.8% higher than for homes without one ($715,000), in purchase appraisals submitted to Fannie Mae and Freddie Mac. Utah ADU Builders Research calculation from FHFA data published Jan. 2, 2025.
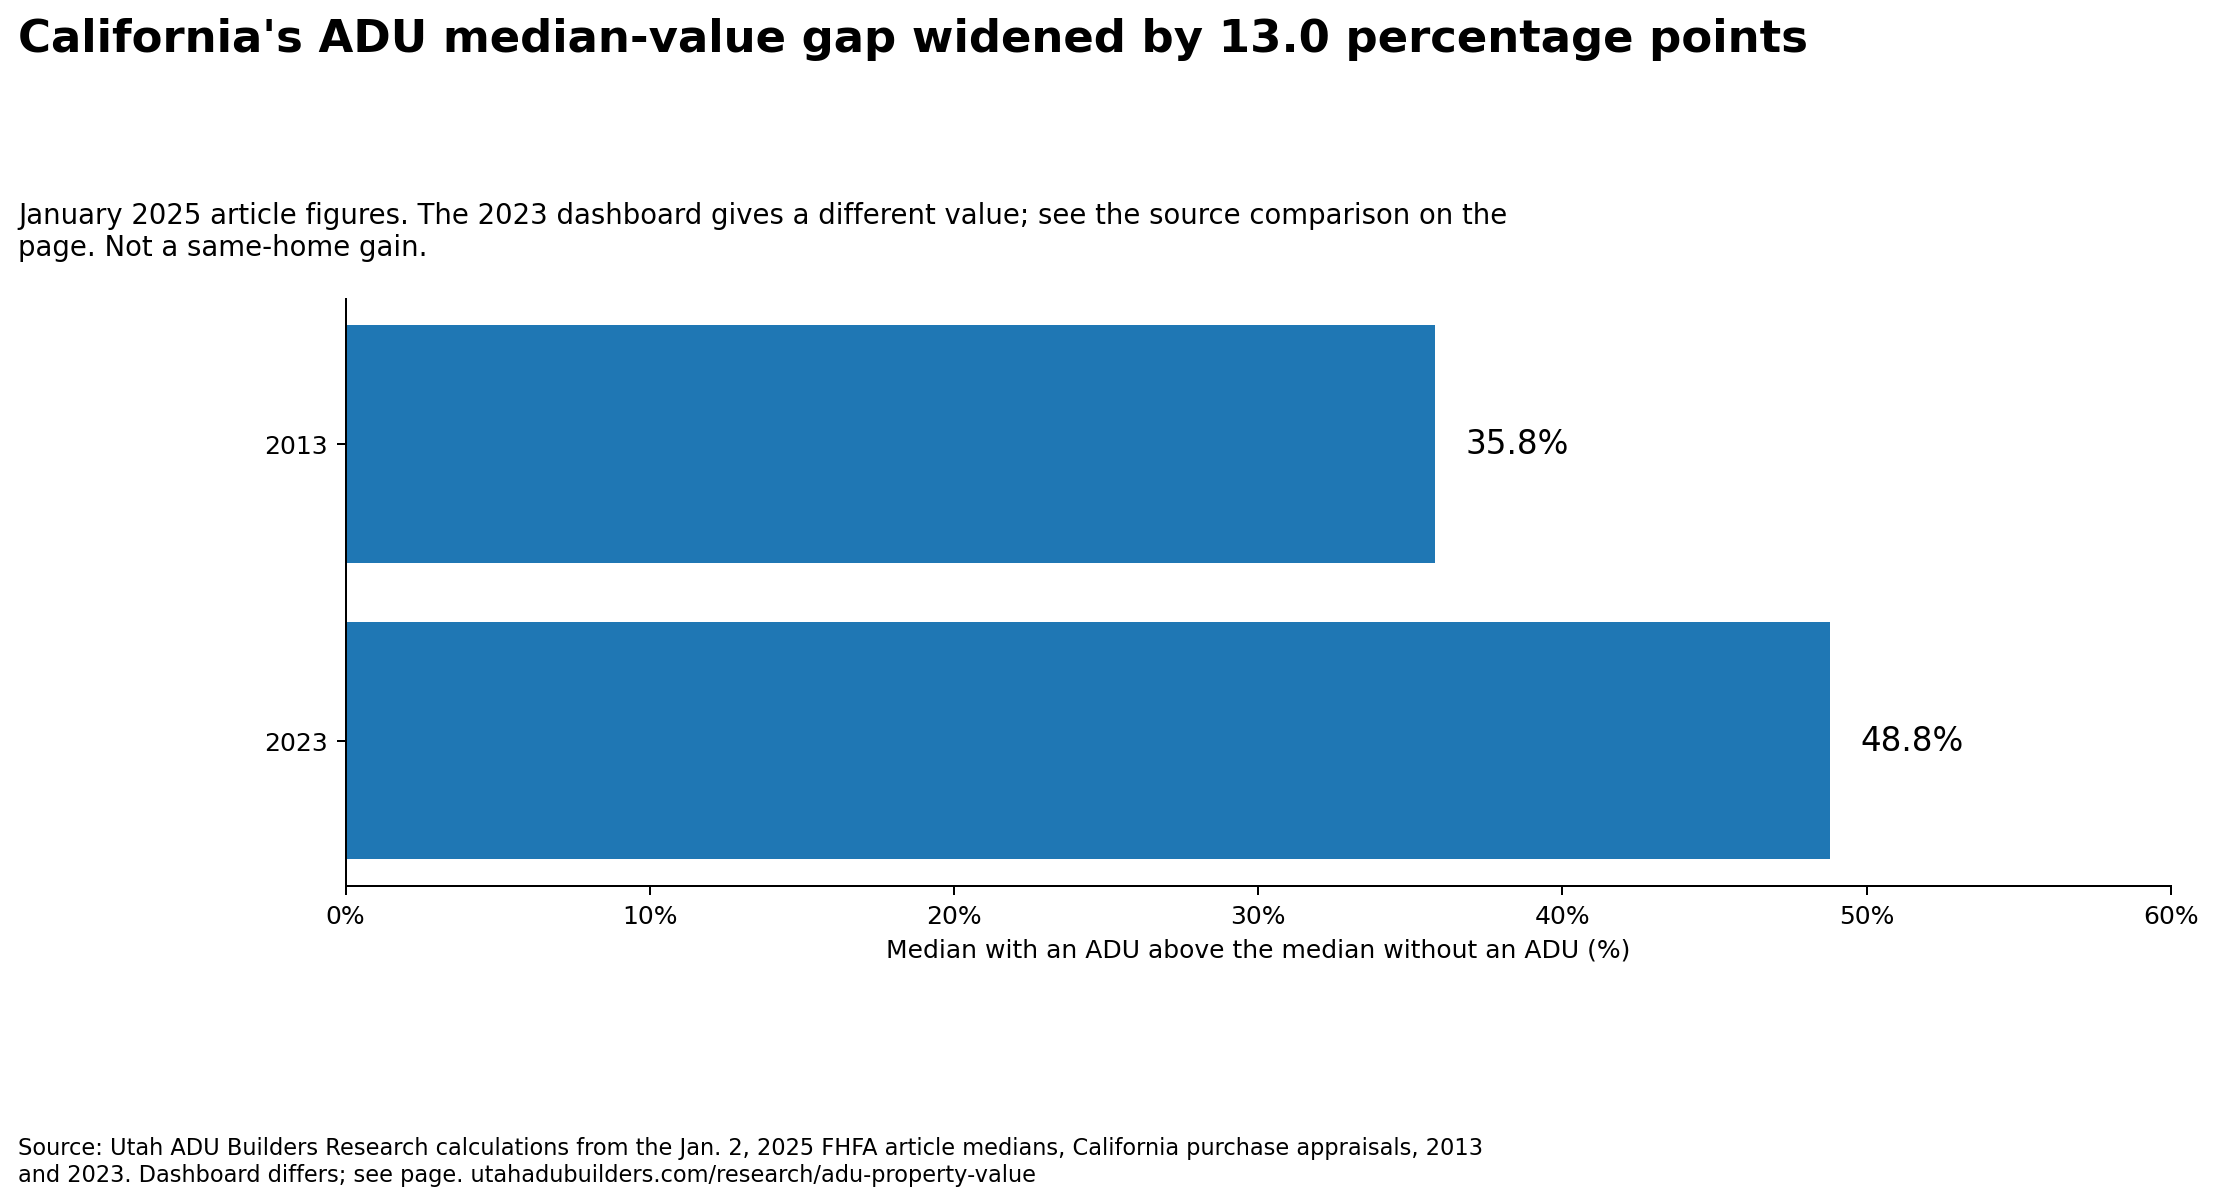
- 13.0 points: California's median appraisal gap grew from 35.8% in 2013 to 48.8% in 2023 in FHFA's January 2025 article figures, a 13.0-percentage-point increase. Utah ADU Builders Research calculation from FHFA article medians.
- $349,000: California's 2023 median appraisal gap in FHFA's January 2025 article figures was $349,000, up $204,000 from $145,000 in 2013. Both medians cover the whole property, house and land, not the ADU alone. Utah ADU Builders Research calculation from FHFA article medians.
- 9.34%: FHFA reports this annualized growth rate for California's ADU-present median, 2013–2023. Its displayed medians give a compound yearly rate of 6.82%, not 9.34%; the article does not give its annualization formula. FHFA article; compound rate calculated by Utah ADU Builders Research.
- 1.2%: Share of U.S. home-purchase appraisals submitted to Fannie Mae and Freddie Mac that flagged an ADU in 2023, up from 0.9% in 2013. FHFA says this is not the share of all homes that have ADUs. FHFA, 2025.
- 2.9%: FHFA's January 2025 article reports that 2.9% of California purchase appraisals flagged an ADU in 2023, about 2.4 times its reported national share of 1.2%. FHFA; ratio of rounded shares by Utah ADU Builders Research.
- 7.20% vs. 6.25%: FHFA's reported annualized growth in national median appraisals for homes with and without ADUs, 2013–2023. These are reported group rates, not returns earned by individual owners. FHFA, 2025, footnote 17.
- 35% is a quoted claim, not a verified finding here: NAR's November 3, 2021 article attributes a 35% price difference to Porch.com. The original Porch report could not be retrieved, so this audit does not verify its sample or calculation. The published reporting describes listing prices—not an ADU construction payoff.
- No significant effect: After Ogden, Utah, legalized ADU rentals in 2016, a peer-reviewed study found no significant change in property values in affected areas compared with unaffected areas. Gnagey, Gnagey & Yencha, Journal of Housing Research, 2023.
- 30%: HUD's limited-or-no-rental-history rule caps counted ADU rent at 30% of total monthly Effective Income—the income used to qualify. Rental-history cases have separate rules. HUD Handbook 4000.1, subject-property rental income; general-rule excerpt checked Sept. 29, 2026.
- Nov. 2, 2026: From this date, new initial appraisal submissions to Fannie Mae and Freddie Mac's UCDP portal must use the redesigned format (UAD 3.6), which includes ADU reporting. Freddie Mac; this is not a requirement to convert every earlier report.
- 11,000 sq ft: From Oct. 1, 2026, covered Utah cities must allow a detached ADU on qualifying lots this size or larger with a permitted single-family home, subject to local standards and the statute's exceptions. Utah Code § 10-21-304.
On this page
- How much more do homes with ADUs appraise for?
- Did the gap grow over time?
- What do the national numbers show?
- Does an ADU add 35% to a home's value?
- What does the evidence say about Utah?
- Why isn't the gap the same as what an ADU adds?
- How do appraisers and lenders treat an ADU?
- Why does this matter now?
- How we built this
- What this data does and doesn't show
- How to cite this page
- Download the data
- Frequently asked questions
- Sources
How much more do homes with ADUs appraise for?
Nationally, the median purchase appraisal for homes with an ADU was $645,000 in 2023, compared with $390,000 without one. That's $255,000, or 65.4%, higher. These are single-family purchase appraisals submitted to Fannie Mae and Freddie Mac, compiled by the Federal Housing Finance Agency (FHFA).
First, two quick definitions. An ADU (accessory dwelling unit) is a second, smaller home on the same lot as a house, with its own place to sleep, cook, and use the bathroom. Think basement apartment, unit over the garage, or backyard cottage. The median is the middle number: line up every appraisal from lowest to highest, and the median sits in the middle.
These gaps compare different whole properties. They do not measure what an ADU adds to a home or whether building one pays off. The yearly CSV includes the same measures for every year from 2013 through 2023 in these three geographies—not all states.

Why does the California article give a different number?
FHFA's January 2, 2025 article reports a $1,064,000 California ADU-present median and 4,910 appraisals for 2023. Its dashboard showed $1,063,000 and 4,909 when checked on September 29, 2026. The no-ADU median is $715,000 in both sources. Neither page explains the difference.
| California, 2023 | January 2025 article | Dashboard checked Sept. 29, 2026 |
|---|---|---|
| Median with ADU | $1,064,000 | $1,063,000 |
| Median without ADU | $715,000 | $715,000 |
| Count with ADU | 4,910 | 4,909 |
| Calculated dollar gap | $349,000 | $348,000 |
| Calculated percent gap | 48.8% | 48.7% |
Sources: FHFA article and FHFA dashboard. Gaps calculated by Utah ADU Builders Research from each source separately. We did not average the conflicting inputs or assume a reason for the difference.
Table A uses the dashboard for all three geographies. Tables 1–3 below reproduce the article's figures, so readers can check the California numbers that other pages quote. The 48.8% article result and 48.7% dashboard result are not interchangeable.
California figures used in the widely cited FHFA article
In FHFA's January 2025 article, the median appraisal for California homes with an ADU was $1,064,000 in 2023, compared with $715,000 for homes without one. That's $349,000, or 48.8%, higher.
| Year | Median with ADU | Median without ADU | Dollar gap | Gap as % of the without-ADU median |
|---|---|---|---|---|
| 2013 | $550,000 | $405,000 | $145,000 | 35.8% |
| 2023 | $1,064,000 | $715,000 | $349,000 | 48.8% |
Source: Medians from FHFA, "Trends in Median Appraised Value for Properties With Accessory Dwelling Units in California," Jan. 2, 2025; Enterprise single-family purchase appraisals. Gaps calculated by Utah ADU Builders Research. Checked Sept. 29, 2026.
Here's an easier way to hold that article figure. For every $100 the California no-ADU median appraised for in 2023, the ADU-present median appraised for about $149.
That's a real difference in appraisals. But notice what it compares: two groups of whole properties, house and land together. It doesn't tell you what the ADU by itself is worth. More on that below.

Why the answer is 48.8%, not 67%
For this comparison, subtract the without-ADU median, divide by that same without-ADU median, then multiply by 100. $1,064,000 minus $715,000 is $349,000. Divide $349,000 by $715,000 and multiply by 100: 48.8%.
One California builder's guide quotes these same FHFA medians and calls the gap "about 67%". If you divide the smaller median by the larger one, $715,000 ÷ $1,064,000, you get 67.2%. That tells you the smaller median is about two-thirds of the larger one. It isn't how much higher the larger one is. The same guide also calls the no-ADU homes "similar," but FHFA's comparison does not match homes on their other features.
Did the gap grow over time?
Yes. In FHFA's January 2025 article figures, California's gap grew from 35.8% in 2013 to 48.8% in 2023, an increase of 13.0 percentage points. In dollars, it grew from $145,000 to $349,000. The dashboard inputs give a 12.9-point increase instead; the sources differ.
A percentage point is the plain difference between two percentages. 48.8 minus 35.8 is 13.0.
| Group | 2013 median | 2023 median | Dollar change | Percent change |
|---|---|---|---|---|
| Homes with an ADU | $550,000 | $1,064,000 | +$514,000 | +93.5% |
| Homes without an ADU | $405,000 | $715,000 | +$310,000 | +76.5% |
| Gap between the groups | $145,000 (35.8%) | $349,000 (48.8%) | +$204,000 | +13.0 percentage points |
Source: Medians from FHFA, Jan. 2, 2025. Changes calculated by Utah ADU Builders Research. Nominal dollars, not adjusted for inflation. Checked Sept. 29, 2026.
One caution keeps this honest. These are different homes each year, not the same homes followed over time. So the table shows how two groups changed, not how any one house grew in value.
FHFA offers one possible reason the ADU group pulled ahead: California's ADU grant program may have led to larger, higher-quality ADUs after 2018. FHFA says that idea needs more study.

What FHFA's "annualized growth" numbers really measure
FHFA's January 2025 article reports annualized growth of 9.34% for California's ADU group from 2013 to 2023, versus 7.65% without ADUs. Its displayed medians give compound yearly rates of 6.82% and 5.85%. The article does not state its annualization formula, and dividing the ADU group's total rise by 10 gives 9.35%, not 9.34%.
| Group | FHFA's reported rate | Total 10-year change | Total ÷ 10 | Compound yearly rate |
|---|---|---|---|---|
| Homes with an ADU | 9.34% | 93.5% | 9.35% | 6.82% |
| Homes without an ADU | 7.65% | 76.5% | 7.65% | 5.85% |
Source: Reported rates and medians from FHFA, Jan. 2, 2025. Other columns calculated by Utah ADU Builders Research. 9.34545… rounds to 9.35%, not 9.34%. The mismatch is unresolved; the reported rate and our calculations stay separate. Checked Sept. 29, 2026.
Why does this matter? A value that really grew 9.34% a year, compounded, would be 2.44 times bigger after 10 years. The ADU group's median grew 1.93 times. So if you quote 9.34%, call it FHFA's reported rate. Don't call it a yearly return.
The same numbers get stretched further online. One page says ADU homes saw "22% faster appreciation". Subtracting 1 from 9.34 ÷ 7.65, then multiplying by 100, gives 22.1%. That compares two reported rates; it does not establish how the other page made its calculation. It doesn't mean any home gained 22% more value. And the builder's guide above turns the rates into ADU homes appreciating "about 9% annually," which FHFA never measured for any single home.
What do the national numbers show?
FHFA's dashboard puts the 2023 national median appraisal at $645,000 with an ADU and $390,000 without one, a 65.4% gap. In 2013, those medians were $375,000 and $240,000, a 56.3% gap. The national gap widened by 9.1 percentage points. These are Utah ADU Builders Research calculations from FHFA dashboard rows, not gains from building an ADU.
FHFA's January 2025 article separately reported that 1.2% of national purchase appraisals flagged an ADU in 2023, up from 0.9% in 2013. It reported annualized median-value growth of 7.20% with an ADU and 6.25% without, 2013–2023.
| Measure | United States | California |
|---|---|---|
| Share of purchase appraisals with an ADU, 2013 | 0.9% | 1.9% |
| Share of purchase appraisals with an ADU, 2023 | 1.2% | 2.9% |
| FHFA-reported yearly median growth, with ADU, 2013–2023 | 7.20% | 9.34% |
| FHFA-reported yearly median growth, without ADU, 2013–2023 | 6.25% | 7.65% |
Source: FHFA, Jan. 2, 2025, including footnotes 16 and 17. Checked Sept. 29, 2026.
1.2% works out to about 1 in 83 appraisals. California's 2.9% is about 1 in 34, roughly 2.4 times the national rate.
Don't read these as the share of homes that have ADUs. FHFA says plainly its appraisal data shouldn't be used that way, because it only covers homes appraised in a given year. The counts also swing with the mortgage market. FHFA's January 2025 article reports that California's ADU appraisals peaked at 9,246 in 2021, then fell to 4,910 in 2023 while overall mortgage volume dropped. Its dashboard shows 4,909 for 2023; see the source conflict.
Does an ADU add 35% to a home's value?
The checked sources do not establish that building an ADU adds 35% to a home. NAR's 2021 article attributes a 35% price comparison to Porch.com. RealTrends' September 2021 coverage describes an August listing-price analysis of the 500 largest U.S. cities. We could not retrieve Porch's original report, so we did not verify those sample details or reproduce 35%.
A listing-price gap between different homes is not a measured gain from adding an ADU.
Here's how the number traveled.
| Date | Source | What it said | What this audit verified |
|---|---|---|---|
| Sept. 2021, according to coverage | Porch.com report (original URL returns 404) | RealTrends and NAR attribute a 35% comparison to Porch | Original report, inputs, sample and calculation not verified |
| Sept. 15, 2021 | RealTrends | Big-city homes with ADUs "priced, on average, 35% higher" | RealTrends describes listing prices; this verifies its reporting, not the original dataset |
| Nov. 3, 2021 | NAR Realtor News | Headline: "Study: ADUs Can Add 35% to Home's Value." Text: homes with ADUs "priced 35% higher," per Porch.com | The headline turned a price gap into added value |
| 2026 | FastExpert | Credits NAR: homes with ADUs priced about 35% higher than "similar properties" | Adds "similar," and credits NAR instead of Porch |
| Updated June 9, 2026 | Apex Homes | Credits NAR: building an ADU can increase property value by about 35% nationwide | Turns a listing comparison into a building payoff |
Source: The four reporting pages were read on Sept. 29, 2026. Porch's original report was not retrieved. These are observations of source wording, not accepted property-value measurements.
Picture comparing trucks with tow hitches to the average vehicle on a lot. A price gap could reflect the trucks themselves, not just the hitches. Homes with ADUs can also differ in house size, lot size and location. A plain price gap mixes all of that together.
We have not treated individual city figures repeated from the missing Porch report as verified measurements. A link to reporting about a study is not the same as its original data.
What does the evidence say about Utah?
Utah's 2023 median purchase appraisal was $666,500 with an ADU and $516,000 without one. That's a $150,500, or 29.2%, gap, according to Utah ADU Builders Research's calculation from FHFA dashboard data. The groups contained 636 and 24,493 appraisal records. These are different homes, not the value gained from building an ADU.
| Year | Median with ADU | Median without ADU | Dollar gap | Gap above without-ADU median | Appraisals with ADU | Appraisals without ADU |
|---|---|---|---|---|---|---|
| 2013 | $300,000 | $250,000 | $50,000 | 20.0% | 217 | 23,729 |
| 2023 | $666,500 | $516,000 | $150,500 | 29.2% | 636 | 24,493 |
Source: FHFA UAD dashboard, Enterprise single-family purchase appraisals, annual Yes/No ADU categories. Checked Sept. 29, 2026. Gaps calculated by Utah ADU Builders Research. Utah's relative gap widened by 9.2 percentage points; the dollar gap grew by $100,500. The CSV has all 11 annual observations, 2013–2023.
What did the Ogden ADU study find?
A peer-reviewed 2023 study found no statistically significant change in property values in areas where Ogden legalized ADU rentals in 2016, compared with areas where it did not. It studied a rule change, not the value of adding an ADU to a house.
The study, by Jenny Gnagey, Matt Gnagey, and Christopher Yencha, appeared in the Journal of Housing Research (vol. 32, no. 2). It used home sales from before and after Ogden's 2016 ordinance. It compared areas where the rule changed with areas where it didn't, and it tracked homes that sold more than once.
The result held up across different model setups. The authors point to two things that may have muffled any effect: black-market long-term ADU rentals in areas where they stayed illegal, and short-term vacation rentals, which were legal citywide. Ogden partially repealed the ordinance in some neighborhoods on July 14, 2020. The study's data come from before that.
Be clear about what this study answers. It asks whether allowing ADU rentals changed home values in a neighborhood. It does not measure what an ADU adds to the home it sits on. For a Utah homeowner worried about neighborhood values, it is local evidence about a rule change. It does not test the effect of a particular neighbor building an ADU, and a non-significant result does not prove the effect is zero.
| Question | What the evidence shows | Source |
|---|---|---|
| Median purchase appraisal, Utah homes with vs. without an ADU, 2023 | $666,500 vs. $516,000; a $150,500 or 29.2% group gap | FHFA dashboard; Utah ADU Builders Research calculation |
| Did legalizing ADU rentals change values in affected areas? (Ogden, 2016) | No statistically significant change found; not proof of zero effect | Journal of Housing Research, 2023 |
| Does an Ogden ADU rental permit transfer when the home sells? | No. A change of ownership voids the permit; the new owner must apply | Ogden City ADU permit application |
| Which lots must covered cities open to detached ADUs? | Qualifying lots of 11,000 sq ft or more with a permitted single-family home, from Oct. 1, 2026; local standards and statutory exceptions apply | Utah Code § 10-21-304 |
Source: As listed in each row. Checked Sept. 29, 2026.
Local rules shape what a buyer can do with an ADU, and that's part of what they pay for. Say you're buying an Ogden home with a permitted basement apartment. The seller's permit doesn't come with the house. You'd need your own, and Ogden requires the owner to live in the main home or the ADU to rent the other unit.
Owner-occupancy rules matter too. Ogden and Cottonwood Heights require the owner to live in the main home or the ADU. Salt Lake City's code also has an occupancy rule, but qualifying relatives and stated exceptions can matter. Don't assume that a buyer can rent out both units—or that every city's rule is the same. See Utah ADU laws by city for local context, Utah ADU permit-data sources and counts, and the SB 284 detached ADU tracker.
Why isn't the gap the same as what an ADU adds?
Because it compares two groups of homes, not one home before and after an ADU. Homes with ADUs can differ in size, lot, age, and neighborhood, and the median gap mixes all of that together. FHFA itself says its appraisal statistics shouldn't be used to appraise an individual property.
To estimate what an ADU adds, you'd need to account for other differences between homes, their location and the timing of the sale. FHFA's appraisal-level public-use file, version 2.1, does not list an ADU field. That file alone cannot support a home-level comparison split by ADU status. The aggregate tables used here do include ADU categories, but not the individual records needed to match homes.
There's also a data-quality wrinkle. FHFA notes that appraisers sometimes mark a home as having an ADU when it doesn't, and sometimes miss one that does.
Keep cost, rent, and value separate
Three different numbers get blended in ADU talk:
- What it costs to build. That's your budget. See what an ADU costs to build in Utah or try the Utah ADU cost calculator.
- What it rents for. That's income, and it depends on local rules about who can rent it and for how long.
- What the whole property appraises for. That's what a lender relies on, and it depends on local sales.
None of the appraisal gaps on this page tell you whether building an ADU pays off on your lot. For that decision, weigh your own cost and rent against local sales. Here's a walkthrough of whether an ADU is worth it in Utah.
If you're weighing an ADU for your own property, Utah ADU Builders' free Utah ADU feasibility check looks at your city's rules, your lot, and a likely cost range. It's a planning step, not an appraisal.
How do appraisers and lenders treat an ADU?
Freddie Mac says appraisers can't ignore a qualifying ADU. They must study how the local market reacts to it, and may assign no extra value only when the market evidence supports that result. ADU rent can also help some borrowers qualify, but the income rules are separate from the appraisal. Fannie Mae's 30% cap and HUD's limited-or-no-history 30% cap do not cover identical cases. Freddie Mac; Fannie Mae; HUD.
Freddie Mac's guidance is blunt: skipping an ADU because there aren't enough comparable sales is unacceptable practice. Comparable sales, or "comps," are recent sales of similar nearby homes that the appraiser uses to judge value.
FHA adds its own steps. Mortgagee Letter 2023-17 requires the appraiser to address whether the ADU can be legally rented, including restrictions, and whether it meets the applicable zoning rules. A legal nonconforming use can qualify under the stated conditions; the letter does not require every ADU to be free of rental restrictions.
| Rule | FHA: general subject-property rules | Fannie Mae |
|---|---|---|
| Property type | One-unit home with an ADU, subject to FHA eligibility | One-unit principal residence |
| Which loans | The 2023 letter excludes using ADU rent for a cash-out refinance | Purchase or limited cash-out refinance |
| ADUs whose rent can count | The single ADU under the cited policy | Rent from one ADU; property and documentation rules still apply |
| Cap | With limited or no rental history, counted ADU rent cannot exceed 30% of total monthly Effective Income | Counted ADU rent cannot exceed 30% of total qualifying income |
| Rental-history distinction | Limited/no history: 75% of the lesser of appraiser market rent or lease rent. Established history uses tax returns and Schedule E under separate rules | Documentation depends on rental history and the applicable Selling Guide provisions |
| Reserves | The cited ADU policy requires two months of principal, interest, taxes and insurance (PITI) after closing when ADU rent is used | Apply the loan's reserve and other eligibility requirements |
| Implementation dates | ADU policy issued Oct. 16, 2023; general rental-income wording checked in the Aug. 12, 2026 handbook excerpt | Manual implementation allowed Oct. 8, 2025; DU 12.1 implementation for new casefiles began the weekend of March 21, 2026 |
Sources: HUD Mortgagee Letter 2023-17; HUD Handbook 4000.1, Update 18, subject-property rental income, limited/no-history and history subsections; Fannie Mae SEL-2025-08; DU 12.1 release notes; Fannie Mae subject-property rental-income guide. Checked Sept. 29, 2026. These are eligibility rules, not an approval promise.
Rehab-loan exception: HUD's 2023 letter also set out a 50% rental-income calculation for Standard 203(k) ADU cases without rental history. We verified that historical provision, but not the full current Standard 203(k) chapter. Do not apply the general 75% example below to a rehab loan without checking its current rules with the lender. 2023 HUD provision.
Here's a hypothetical using FHA's general no-history calculation, not the Standard 203(k) exception. Say an appraiser puts market rent for a basement apartment at $1,400 a month, the buyer has no rental history, and there's no lease for less. The calculation is 75% of $1,400, or $1,050 a month. That amount can count only if the 30% limit and the other eligibility, reserve and documentation rules are met.
For the local appraisal process, see how ADU appraisals work in Utah. For Utah programs and loans that help with ADUs, see Utah ADU loans and programs.
Why does this matter now?
Two changes land 32 days apart. On Oct. 1, 2026, Utah Code § 10-21-304 requires covered cities to allow detached ADUs on qualifying lots of 11,000 square feet or more with a permitted single-family home. Local standards and the law's stated exceptions still apply; lot size alone does not grant a building or rental permit.
On November 2, 2026, UAD 3.6 becomes required for new initial appraisal submissions to UCDP. Freddie Mac's September 30 FAQ update confirms the initial-submission-date trigger and says a lender requiring an exception must request it from each applicable GSE. The new format reports ADUs more consistently; it does not establish when FHFA will publish corresponding aggregate fields.
The value evidence and these rule changes belong on different timelines. The appraisal tables here describe 2013–2023 properties. They do not measure the effect of Utah's October 2026 law or the November 2026 appraisal format.
How we built this
Sources and coverage. On September 29, 2026, we read the tables in FHFA's UAD dashboard for the National series, Utah and California. We collected the median appraised value and appraisal count for the Yes and No ADU categories in each year from 2013 through 2023: 132 source values, arranged as 33 geography-year rows in the clean yearly CSV. We also checked the figures in FHFA's California ADU article from January 2, 2025.
Exact dashboard selections. Advanced Analytics → Enterprise Single-Family → Purchase → National or State → Utah or California → Accessory Dwelling Unit Present → Yes/No → Annual. We read Median Appraised Value and Appraisal Count separately. We checked the geography, period, purpose, category and statistic header in the returned rows, not just the selected controls: the page sometimes left an earlier table visible after a filter changed. We removed repeated copies of the same rows, not distinct appraisals.
Two sources, not one blended series. California's 2023 ADU-present median and count differ between the article and dashboard. Table A and the yearly CSV use the dashboard. Tables 1–3 and the two article-reproduction charts use the article. The conflict table shows both. We did not assume which number is a revision or average the two. The broader evidence CSV labels each source separately.
Release date. The latest download release listed on FHFA's data page on September 29, 2026 was version 3.3, released December 18, 2024, with annual data through 2023 and quarterly data through 2024 Q3. The dashboard displayed the same time coverage. Its exact revision history relative to the article was not established.
What those appraisals cover. They are single-family appraisals submitted to Fannie Mae and Freddie Mac's portal. That includes appraisals for loans the companies didn't end up buying. It leaves out loans that skipped a traditional appraisal, according to FHFA's data documentation. The national series includes the 50 states, DC and Puerto Rico. Purchase and refinance appraisals, FHA appraisals and condominium appraisals were not mixed together.
Calculations. Every calculated gap, change and ratio has its inputs and formula in the evidence CSV. We calculate with unrounded ratios, then round percent gaps to one decimal place and yearly rates to two:
- Dollar gap = median with ADU − median without ADU.
- Percent gap = (median with ADU − median without ADU) ÷ median without ADU × 100.
- Change in gap = 2023 percent gap − 2013 percent gap, in percentage points.
- Total percent change = (2023 median ÷ 2013 median − 1) × 100.
- Compound yearly rate = [(2023 median ÷ 2013 median)^(1/10) − 1] × 100.
For example, Utah's 2023 gap is ($666,500 − $516,000) ÷ $516,000 × 100 = 29.1667%, displayed as 29.2%. The national calculation is ($645,000 − $390,000) ÷ $390,000 × 100 = 65.3846%, displayed as 65.4%. Extra decimals in the CSV show the arithmetic, not greater precision in the source data.
Missing and suppressed data. The dashboard view used here returned Yes and No rows, not a Missing-category count. We did not turn that omission into zero or use the two counts as a verified all-category denominator. FHFA's documentation suppresses some small cells and applies complementary suppression; a blank or suppressed value is not zero. The dictionary defines a Missing ADU category. None of the included median or count cells displayed a suppression marker; we did not retrieve the raw file's separate suppression flags.
What we checked directly on Sept. 29, 2026:
- FHFA's national, Utah and California dashboard rows, the California article, and data documentation.
- HUD Mortgagee Letter 2023-17, targeted general-rental-income excerpts from the August 2026 handbook, Fannie Mae's announcement and release notes, and Freddie Mac guidance.
- Utah Code § 10-21-304, Ogden's permit application, the cited local occupancy sources, and the publisher's abstract and notes for the Ogden study.
- Each reporting page quoted in Tables 3 and 5. Those checks establish what the pages said, not whether their underlying claims were correct.
What we did not do. We did not examine individual appraisals, survey anyone, or appraise any property. We did not retrieve all-state or Utah metro rows, reproduce the Ogden regression analysis, recover the original Porch dataset, or fully verify the current Standard 203(k) handbook chapter. The state ZIP could not be processed in this audit; the dashboard was the successful retrieval route. This is an analysis of published data, not a new homeowner survey or a 50-state valuation study.
What this data does and doesn't show
It shows:
- How median purchase appraisals compared nationally, in Utah and in California for homes with and without ADUs, 2013–2023.
- The appraisal counts behind the dashboard categories, plus the national and California shares reported in FHFA's January 2025 article.
- Where the checked reporting attributes the “35%” claim, and what remains unverified.
- What the cited appraisal and lending sources say, with the FHA rehab-loan verification limit stated separately.
It doesn't show:
- What an ADU adds to any one home. The groups aren't matched for house size, lot, quality, location or other features.
- Sale prices in the FHFA tables, or homes outside the stated appraisal-submission coverage. The separate Ogden study used sales; it is not the same dataset.
- Whether each ADU was permitted. FHFA's ADU flag is not a permit record, and appraisers sometimes mark it wrong.
- Appraisal figures after 2023, a complete state comparison, or Utah city and metro valuation gaps.
- Inflation-adjusted changes. All dollars are nominal.
- Short-term rental returns or the effect of Utah's 2026 law on home values.
This page is educational. It isn't appraisal, lending, legal, or tax advice.
How to cite this page
Utah ADU Builders Research. "ADU Property Value: A 65.4% National Gap in 2023, Plus Utah Data." Utah ADU Builders, updated September 2026. https://utahadubuilders.com/research/adu-property-value
Ready-to-quote national finding:
In 2023, the national median purchase appraisal was $645,000 for homes with an ADU and $390,000 for homes without one—a $255,000, or 65.4%, gap—according to Utah ADU Builders Research's analysis of FHFA dashboard data. This compares different whole properties, not the value added by building an ADU.
Ready-to-quote Utah finding:
Utah's 2023 median purchase appraisal was $666,500 with an ADU and $516,000 without one, a $150,500 or 29.2% gap, according to Utah ADU Builders Research's analysis of FHFA dashboard data. The groups contained 636 and 24,493 appraisal records; the gap is not the ADU's stand-alone value.
The original California article finding remains available to quote with its source identified:
In FHFA's January 2, 2025 article figures, California's median purchase appraisal gap was 48.8% in 2023, up from 35.8% in 2013, according to Utah ADU Builders Research's calculations. FHFA's dashboard gives 48.7% for 2023 instead. Neither figure measures the value an ADU adds to a home.
Reuse. You may reuse our original text, calculations, table arrangement and chart designs with credit by name to Utah ADU Builders Research. Keep FHFA credited for its figures and preserve the attribution and terms of any other underlying material; this permission does not license third-party text or imagery.
Download the data
- ADU Appraisal Evidence Table (CSV, 267 rows): source inputs, calculations with formulas, separately labeled quoted-claim audits, the Ogden study finding, and the cited rules. Each row has a source link, check date and verification status. A quoted claim is not an accepted measurement.
- Yearly national, Utah and California appraisal data (CSV, 33 rows): dashboard medians, counts and calculated gaps for 2013–2023. This file uses only the dashboard series.
- National and Utah comparison chart (PNG), California article medians chart (PNG), and California article gap chart (PNG), each with its source line built in.
No form, no sign-up.
Frequently asked questions
Does an ADU increase property value?
Homes with ADUs had higher median purchase appraisals in the checked 2023 data: 65.4% nationally and 29.2% in Utah. But that compares different homes, so it doesn't prove the ADU caused the gap. Utah's Ogden study asked a different question and found no statistically significant effect of the 2016 rental-legalization policy. FHFA dashboard; Ogden study.
How much value does an ADU add?
The checked FHFA tables do not measure the amount added by building an ADU. They show a $255,000 national gap and a $150,500 Utah gap between the two whole-property medians in 2023. What your ADU adds depends on local market evidence, which an appraiser has to study. FHFA; appraisal guidance.
Is the $349,000 the value of the ADU?
No. It's the difference between two California medians in FHFA's January 2025 article, and both cover the whole property, house and land. The dashboard instead gives a $348,000 gap for 2023. Homes with ADUs may also differ in house size, lot size and location. Two-source comparison.
Where does the “35%” figure come from?
NAR's November 3, 2021 article and RealTrends' September 2021 coverage attribute it to Porch.com. Their reporting describes a listing-price comparison, but the original report could not be retrieved, so this audit does not verify its sample or reproduce the 35%. It is not evidence that building an ADU adds 35%. NAR; reporting trail.
Do the California numbers apply to Utah?
No. Utah has its own figures: $666,500 with an ADU and $516,000 without one in 2023, a 29.2% median gap. California's gap is 48.7% in the same dashboard. Neither is a construction-payoff estimate. FHFA dashboard.
Will an ADU next door lower my home's value?
After Ogden legalized ADU rentals in 2016, researchers found no statistically significant change in property values in affected areas compared with unaffected ones. That is evidence about one city's policy change, not a test of a particular ADU next door or proof of zero effect. Ogden study.
Can ADU rent help me qualify for a mortgage?
Sometimes. HUD's general limited-or-no-history calculation uses 75% of the lesser of market or lease rent, with a 30% Effective Income cap; established rental history and rehab loans have separate rules. Fannie Mae permits rent from one ADU on an eligible one-unit principal residence for a purchase or limited cash-out refinance, capped at 30% of qualifying income. HUD; Fannie Mae; rule details and rehab verification limit.
Are these 2026 home values?
No. We checked the sources in September 2026, but the appraisal series covers 2013–2023. FHFA's latest download release listed at that check was December 2024, with full-year data through 2023. FHFA data page.
Sources
- Federal Housing Finance Agency. "Trends in Median Appraised Value for Properties With Accessory Dwelling Units in California." Jan. 2, 2025. Article figures are reproduced separately from the dashboard. Checked Sept. 29, 2026.
- Federal Housing Finance Agency. "Uniform Appraisal Dataset (UAD) Aggregate Statistics." Data page; latest listed download release v3.3, Dec. 18, 2024. Checked Sept. 29, 2026.
- Federal Housing Finance Agency. "UAD Aggregate Statistics Data File Overview." Oct. 28, 2024; coverage, suppression, uses and limits. Checked Sept. 29, 2026.
- Federal Housing Finance Agency. "UAD Aggregate Statistics Data File Dictionary." Oct. 28, 2024; ADU category definitions. Checked Sept. 29, 2026.
- Federal Housing Finance Agency. "UAD Appraisal-Level Public Use File Data Dictionary, Version 2.1." Feb. 4, 2025. Checked Sept. 29, 2026.
- RealTrends. "Where ADUs add value (and where they don't)." Sept. 15, 2021. Reporting trail only; not a verified reconstruction of Porch data. Checked Sept. 29, 2026.
- National Association of Realtors. "Study: ADUs Can Add 35% to Home's Value." Nov. 3, 2021. Quoted-claim audit only. Checked Sept. 29, 2026.
- Apex Homes. "How Much Value Does an ADU Add to a Home in California?." Updated June 9, 2026. Quoted-claim audit only. Checked Sept. 29, 2026.
- FastExpert. "ADU Impact on Property Value." March 2, 2026. Quoted-claim audit only. Checked Sept. 29, 2026.
- Custom Home. "Hidden Cost of a Cheap ADU on a Luxury Property." March 13, 2026. Quoted-claim audit only. Checked Sept. 29, 2026.
- Gnagey, Jenny, Matt Gnagey, and Christopher Yencha. "The Impact of Legalizing Accessory Dwelling Unit Rentals on Property Values: Evidence from Ogden, Utah." Journal of Housing Research 32(2): 103–122, 2023; first online Aug. 9, 2022. doi:10.1080/10527001.2022.2106039. Publisher abstract and notes checked; regressions not reproduced. Checked Sept. 29, 2026.
- Ogden City. "Accessory Dwelling Unit Permit Application." Ownership-change and occupancy terms. Checked Sept. 29, 2026.
- Utah Legislature. "Utah Code § 10-21-304, Detached accessory dwelling units." Effective Oct. 1, 2026; qualifying lots, local standards and exceptions. Checked Sept. 29, 2026.
- Utah ADU Builders Research. "Utah ADU Laws by City." Related reference, not a substitute for current municipal code. Checked Sept. 29, 2026.
- Federal Housing Finance Agency. "UAD Aggregate Statistics Dashboard Portal." National, Utah and California annual purchase-appraisal rows, 2013–2023; medians and counts read from table cells. Checked Sept. 29, 2026.
- Freddie Mac. "A Practical Guide to Appraising Accessory Dwelling Units (ADUs)." Sept. 9, 2026. Checked Sept. 29, 2026.
- U.S. Department of Housing and Urban Development. "Mortgagee Letter 2023-17: ADU rental income and appraisal protocols." Oct. 16, 2023. Standard 203(k) 50% provision cited as historical, not independently confirmed current. Checked Sept. 29, 2026.
- Fannie Mae. "Selling Guide Announcement SEL-2025-08." Oct. 8, 2025; manual implementation allowed immediately. Checked Sept. 29, 2026.
- Freddie Mac. "Uniform Appraisal Dataset (UAD) 3.6 FAQ." Transition rule for new initial UCDP appraisal submissions. Checked Sept. 29, 2026.
- Fannie Mae. "DU Version 12.1 Release Notes." Jan. 28, 2026, updated Feb. 18, 2026; implementation weekend March 21, 2026. Checked Sept. 29, 2026.
- Fannie Mae. "Rental Income from the Subject Property." Selling Guide page dated Sept. 2, 2026; follow the applicable implementation provisions. Checked Sept. 29, 2026.
- U.S. Department of Housing and Urban Development. "Handbook 4000.1, Update 18." Aug. 12, 2026. Targeted general-rental-income excerpts checked; full current Standard 203(k) chapter not independently verified. Checked Sept. 29, 2026.
- Cottonwood Heights. "Accessory Dwelling Units." Official owner-occupancy FAQ. Checked Sept. 29, 2026.
- Salt Lake City. "Code § 21A.40.200, Accessory Dwelling Units." Owner/family occupancy and stated exceptions. Checked Sept. 29, 2026.